Coastal » Unit 1: Beach Today, Gone Tomorrow? » Activity 3: Causes and Consequences of Coastal Erosion
Materials & Setup
In Advance Student Reading and Questions
- As homework, assign the Student Pages “Beaches on a Budget: Why Do Beaches Come and Go?” (pp. 42-45) and “Beaches on a Budget: Questions About the Reading” (pp. 46-48).
Class Period One
For each lab group of three to four students
- “Baldwin and Kanahā Beach Aerial Photo” acetates (master, pp. 40-41)
- Baldwin and Kanahā “Beach Study Maps and Graphs” (legal-size masters included with this curriculum). Each lab group should have the information that corresponds to its assigned beach.
- Two copies of the Student Page “Coastal Erosion Projections” (pp. 49-51)
- Overhead projector
- One sheet of legal-size or larger paper
- Colored pens or pencils
- Masking tape
For each student
- Student Page “Beaches on a Budget: Why Do Beaches Come and Go?” (pp. 42-45)
- Student Page “Beaches on a Budget: Questions About the Reading” (pp. 46-48)
- Student Page “Beach Management Alternatives” (pp. 52-53)
Instructions
1) Review student questions and responses to the homework, especially question #7 in which they explained the impact of shoreline armoring and longshore currents on beach erosion and accretion. This question is designed, in part, to help students understand how longshore currents transport and deposit sediment along coastlines, and how disrupting this current can lead to changes in the normal patterns of beach erosion and accretion.
2) Divide the class into lab teams of three to four students. Give each team a copy of the Beach Study Map and Graph for either Kanahā or Baldwin beach.
3) Explain that the black-and-white photos and maps are excerpts from a study published in 1991. The study looked at coastal erosion by comparing aerial photos taken in 1950, 1964, 1975, 1987, and 1988. At each of several transects, the authors calculated the rate of coastal erosion during intervals between photos. They looked at the changing location of the coastal vegetation line to track erosion and accretion. The results are presented in the graphs that accompany each map.
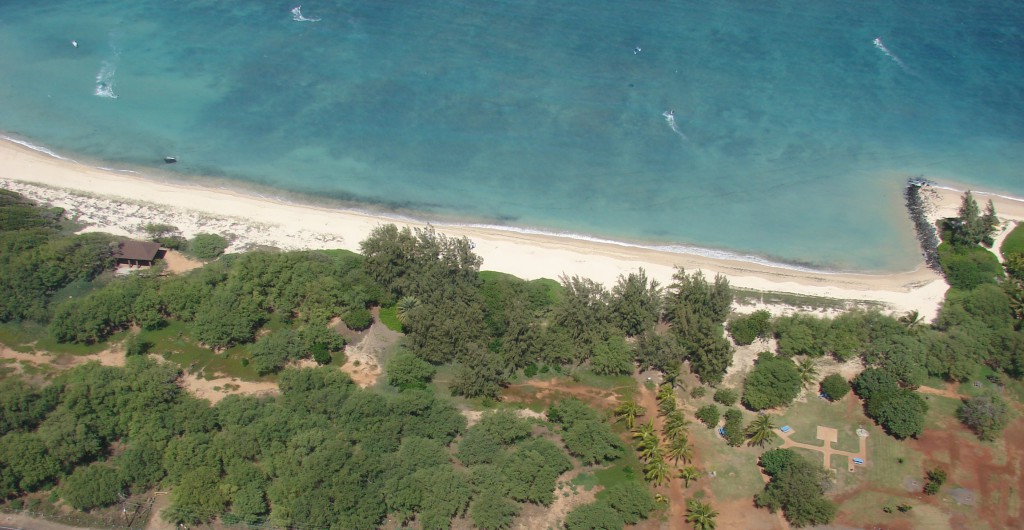
4) Project the “Baldwin Beach Aerial Photo” and “Kanahā Beach Aerial Photo” acetate onto the groups’ legal-sized or larger papers taped to the wall. Have each group trace its assigned beach from this image, including the water line and the vegetation line, along with any shoreline armoring that appears on the map and important reference points such as roads or large, recognizable facilities. Students can use the line-drawn maps from the 1991 study as a guide for which features could be useful to include on their tracing. When they have finished tracing the color image, they should add and number the transect lines from the corresponding “Beach Study Map and Graph.”
5) Have students complete the steps and answer the questions on the Student Page “Coastal Erosion Projections.”
6) After lab groups finish their work, have a class discussion to compare results and talk about how these kinds of projections can contribute to coastal management decisions.
7) Assign the Student Page “Beach Management Alternatives” as homework.
Journal Ideas
- How should projections for future shoreline erosion affect people’s decisions about where and how to build houses, hotels, condominiums, roads, and other structures?
- How far into the future do you think people should look when weighing the benefits and drawbacks of shoreline armoring such as seawalls and groins?
Assessment Tools
- Student Page “Beaches On a Budget: Questions About the Reading” (teacher version, pp. 35-37)
- Traced paper maps (evaluate for neatness and accuracy)
- Student Page “Coastal Erosion Projections” (teacher version, pp. 38-39)
- Short paper describing how Baldwin or Kanahā beaches should be managed
- Participation in group work and class discussion

