Rain Forest » Unit 4: Impact of Invaders: Pigs in Forests and Bogs » Activity 3: School Grounds Vegetation Surveys
Materials & Setup
In Advance
- Look around the grounds for a site where students will be able to establish several one-meter-square plots with a range of plant species and cover density to survey (e.g., probably not on the lawn!). Look for an area that has vegetation that is mostly low-lying.
Class Period One
Per group of three to four students
- Four large, four- to six-inch nails or tent stakes, with their tops painted orange
- Five meters of string
- One-meter measuring stick
- Student Page “Conducting Your Vegetation Survey” (pp. 32-36).
- Ten copies of “Vegetation Survey Data Sheet” #1 and #2 from the student page (pp. 35-36)
Class Period Three
Instructions
Class Period One:
1) Begin the vegetation survey activity, following the instructions given on the Student Page “Conducting Your Vegetation Survey.” Here are the basics:
- Each student team establishes a one-meter-square plot.
- Each team draws a map of the survey site that includes all of the plots. As a class, they agree on (or you impose) a numbering system so that each plot has an identifying number.
- Each team surveys the vegetation in its plot and records its observations on “Vegetation Data Sheet #1.”
2) Leave at least the corner stakes of each plot in the ground overnight. You may leave the string that marks the plot boundaries, as well, if the study site is out of the way.
Class Period Two:
1) Continue the vegetation survey activity, following the instructions given on the Student Page “Conducting Your Vegetation Survey.” Here are the basics:
- Teams “swap” plots with another team, surveying the vegetation in the other team’s plot and recording their observations.
- The pairs of teams that swapped plots compare each team’s recorded observations of the two plots with the partner team’s observations. Since each of these two teams has surveyed the same plots, they can look for differences in their observations, figure out why these differences exist, and go back and look at the plots again to try to reach an agreement.
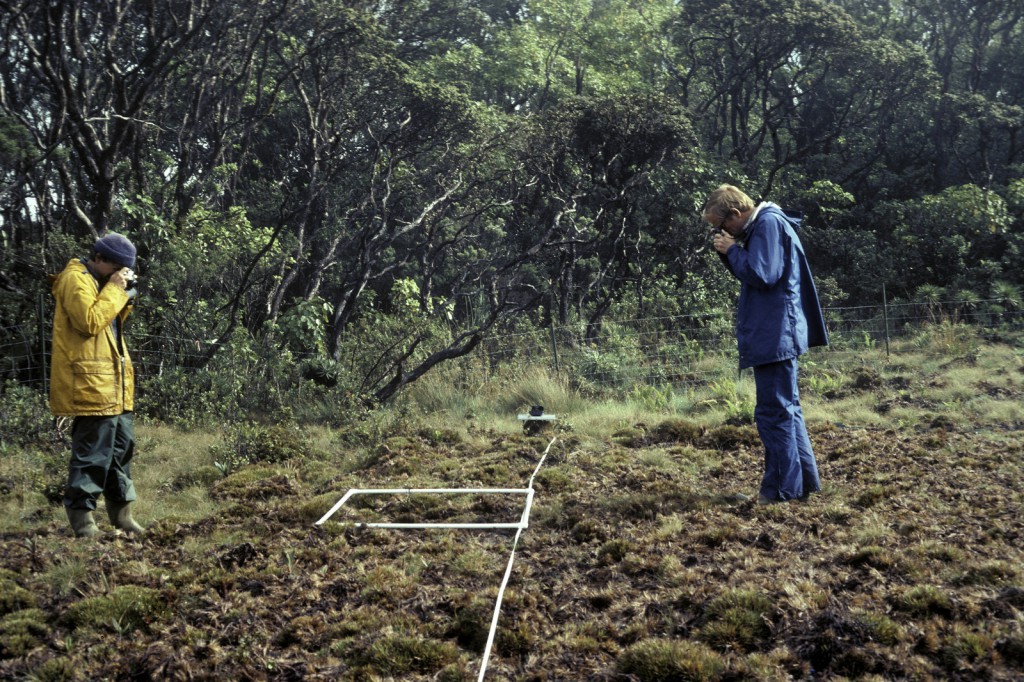
Student teams should note the differences on the student page as well of whether/how they resolved this difference. (Comparing notes and working out disagreements like this is similar to the process that researchers in Haleakalā used when they monitored revegetation in Greensword Bog.)
Class Period Three:
1) Put the blank “Cover and Frequency Chart” on the board or overhead.
2) Record data for all of the plots on this chart. Ask each team to contribute its findings. Because students did not identify the species growing in their plots but rather made sketches, completing the chart for the whole class may be a bit of a challenge. Do the best you can, asking student teams to compare sketches when they need to decide whether they have identified the same species or type of plant as another team.
3) Using this class chart, illustrate the difference between the concepts of “frequency” and “cover.”
- “Frequency” refers to how many plots a particular plant species or type appears in. Frequency is expressed as a percentage of the total number of plots. (Frequency is a meaningful calculation only if one is observing more than one plot; otherwise, the frequency can only be zero or 100 percent.) When researchers are studying a large area with many plots, calculating frequency helps them understand how widely distributed throughout the whole site the species is.
- “Cover” refers to the area of ground covered by the plant species or type. It is expressed as a percentage of the total ground area within a plot. When studying a large area with many plots, researchers calculate the total cover of each species by finding the mean cover value from all of the plots.
4) With the whole class, discuss the findings of their vegetation surveys and what they learned from doing the surveys.
Journal Ideas
- How do you think vegetation surveys could be used as a conservation tool in rain forests, bogs, and other ecosystems on Haleakalā?
- When scientists design vegetation studies, they need to decide plot size and how many plots to use. What do you think scientists need to consider when making those decisions?
- Find photographs of different kinds of vegetation from the Internet or magazines. What size plot would you use to survey each different kind? Why?
Assessment Tools
- Student Page “Conducting Your Vegetation Survey”
- Participation in group work and class discussion
Media Resources
- None

